


Consumer Data Protection: Data Scientists And Data Security
SOURCE: WWW.DISCOVERDATASCIENCE.ORG/
AUG 14, 2023
What is the Poisson process and how is it used in data science?
SOURCE: ANALYTICSINDIAMAG.COM
APR 16, 2022

Mathematics and data science share an unbreakable connection and different mathematical functions are being used in the operations of data science. The probability theory is a major part of mathematics and not only does it help us in measuring models but also helps in modeling data. The Poisson process is also a part of a mathematical and probabilistic theory that has many important applications. There are various Poisson process use cases in data science. In this article, we are going to discuss the Poisson process use cases in data science. The major points to be discussed in the article are listed below.
Let’s first discuss the paradigm of Poisson.
Probability theory and statistics are the parts of mathematics and the Poisson paradigm can be considered as the part of probabilistic theory and statistics. Various probability theories enable us to calculate and interpret the distribution of randomly selected variables. We mainly find the use of the Poisson process and distribution when the number of upcoming events is large and their probability of occurring is very low.
Mathematically we convert this scenario as the number of events n that has the tendency to go toward infinity and the occurring probability is p that tends to go toward zero. We can also consider this paradigm as the updated version of the binomial paradigm which means the approximation of binomial distribution is Poisson distribution.
Under this paradigm, it is assumed that the events have independent features or they are dependent in a time interval manner like monthly dependent. The independent word means that any of the events that have occurred will not give any information about any upcoming event; both of them are not correlated. In some cases, we also consider this paradigm as an approximation of a binomial to a Poisson distribution. Let’s go deeper into this concept.
The Poisson process can be considered as a counting process where the whole process gives the results as the counting of occurrences of a certain event that has a random structure and that has the probability of happening at a certain rate. We can understand this by taking the example of earthquakes in a certain area where the frequency of earthquakes is 3 per year but the timings of earthquakes are completely random. In such situations, the Poisson process can be a better fit model for us.
We can apply the Poisson process if the situation is fulfilling the following criteria
One of the major things to notice here is that the events can be compared to the Bernoulli trials which means they are asynchronous or discrete that is events are either success or failure. For the above-given example, the interval we are choosing is 1 year but the sub-interval is the time when the earthquake is activated or deactivated. We can visualize the Poisson process in the following way.

In the above image, we can see that the Poisson process is starting at 0 and some increments occur continuously but independently and the rate is ?.
In the above, we have seen that the Poisson process is a model that can be utilized to describe the occurrence of random events, and this model works mainly based on the theory of Poisson distribution. So it becomes a necessity for us to understand the Poisson distribution. Talking in mathematical terms we can consider this distribution as the discrete probability distribution that helps in representing the probability of occurring events in a fixed time distance, area, or volume interval where the rate of occurrence is constant and independent of other events.
The probability mass function under this distribution can be given as follows:

Whare,
= E(X) = Var(X)
If the constant value of occurrences of event is not given then we can adapt the following equation

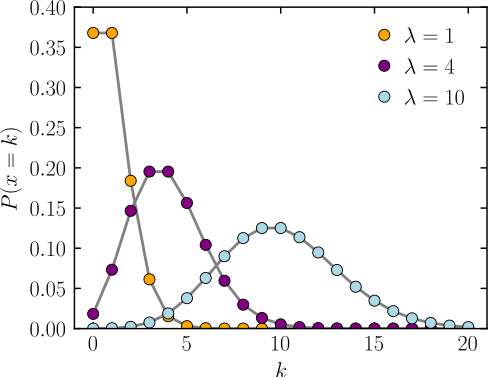
Where r is the average rate of occurrence of events. The below image is a representation of the probability mass function of the Poisson distribution.

In the image, k represents the number of occurrences, and P(x = k) is the probability of k occurrences when the value of ???? is given. We can utilize Poisson distribution to model the following example events.
Here we can now understand what are the situations that can be modeled using the Poisson process. Let’s see how we can implement the Poisson distribution using the python language.
For the implementation of Poisson distribution, we can utilize the functions from the scipy library. Let’s see how we can do that
from scipy.stats import poisson import matplotlib.pyplot as plt fig, ax = plt.subplots(1, 1) mu = 0.6 mean, var, skew, kurt = poisson.stats(mu, moments='mvsk') x = np.arange(poisson.ppf(0.01, mu), poisson.ppf(0.99, mu)) ax.plot(x, poisson.pmf(x, mu), 'bo', ms=8, label='poisson pmf') ax.vlines(x, 0, poisson.pmf(x, mu), colors='b', lw=5, alpha=0.5) rv = poisson(mu) ax.vlines(x, 0, rv.pmf(x), colors='k', linestyles='-', lw=1, label='frozen pmf') ax.legend(loc='best', frameon=False) plt.show()
Output:

In the above example, we have generated 100 randomly generated samples, and then using the mu variable we have drawn the Poisson PMF in the graph. After implementation let’s see where we can need this theory in the data science journey.
There are various use cases of the Poisson process that can be found in the field of data science. Some of them are as follows:
Here we have seen the use cases of the passion process in real-life problems such as detecting whether, number of calls on the phone, the number of times when a phone or laptop is being used, etc.
In this article, we have understood the Poisson process in which we have discussed the paradigm and distribution of the passion process. Along with this, we have seen how we can implement and use it in different cases.
Yugesh is a graduate in automobile engineering and worked as a data analyst intern. He completed several Data Science projects. He has a strong interest in Deep Learning and writing blogs on data science and machine learning.
LATEST NEWS
WHAT'S TRENDING


Data Science
5 Imaginative Data Science Projects That Can Make Your Portfolio Stand Out
OCT 05, 2022

SOURCE: WWW.DISCOVERDATASCIENCE.ORG/
AUG 14, 2023


SOURCE: MEDIUM.DATADRIVENINVESTOR.COM
OCT 05, 2022

SOURCE: VENTURESAFRICA.COM
OCT 05, 2022