


Digital twins on the manufacturing menu – with help from the hyperscalers
SOURCE: HTTPS://WWW.IOTTECHNEWS.COM/
NOV 16, 2023
How Graph Technology Combats Climate Change
SOURCE: RTINSIGHTS.COM
MAR 14, 2022
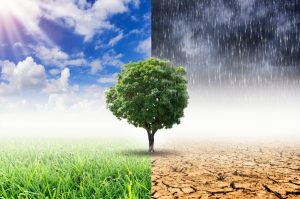
The climate change clock is ticking —and the alarm has been ringing for years.
Headlines about higher global temperatures and extreme weather-related disasters (and more of them) have become all too familiar. As global energy-related CO2 emissions are predicted to grow by almost five percent this year, countries worldwide are working to prevent a global catastrophe — a catastrophe that would encompass not only weather events but crop growth, infectious diseases, rising sea levels, melting glaciers, polluted air, and much more. In fact, climate change could result in more than 100 million people living in extreme poverty by 2030 unless definitive action is taken.
The energy sector is a key player in this collective effort to reduce emissions. Energy accounts for two-thirds of total greenhouse gas, and sustainable, renewable energy sources can help combat climate change. Mercury is a New Zealand power company that generates electricity from 100% renewable sources – hydro, geothermal, and wind. The company, based in Auckland, also sells electricity to customers through its retail brands – Mercury and GLOBUG. Mercury’s continued investment in low carbon electricity generation is helping New Zealand move to a low-emissions future — and the company’s use of graph technology to manage and monitor effective energy use can serve as a model for others in the energy sector.
Mercury uses graph technology to optimize energy generation and map to specific customer use cases, delivering the right service to the right customer. The graph also allows teams to simulate critical new product decisions and address pain points before putting them into actual practice.
As part of Mercury’s commitment to sustainable energy use, the company taps New Zealand’s array of natural resources to generate energy for customers — and uses graph technology to create a digital twin, a network model that incorporates real-time analytics to model and predict energy supply. Mercury’s digital twin allows its team to monitor the different physical aspects of the actual Waikato River, New Zealand’s longest river, which runs for 264 miles through the North Island. Mercury manages multiple substations, turbines, as well as channels that narrow to increase water flow. The digital representation of the river allows Mercury to simulate all critical decisions and understand various dependencies.
For example, if the company wants to place a turbine in one place:
The graph-based decision management platform helps the team attempt various digital scenarios to determine the best option for the actual river asset.
Meanwhile, Mercury also uses graph technology for customer experience. Mercury can monitor for peak energy consumption or potential problems. If “Joe Smith” receives a higher-than-normal energy bill, but his energy use patterns haven’t changed, the customer team can use the graph to determine why. In Joe’s case, team members can summon a geospatial map and see various dots that represent customers. Zooming in, they see there are meter problems in Joe’s area due to cable issues that affected meter readings. Thus, the meter was not reading properly and was generating inaccurate numbers and a higher-than-normal bill.
Other uses to help with customer experience include predicting customer energy use patterns.
If a customer’s son goes off to college, how much will that customer’s total energy usage decrease? Is there a type of energy package that will then best serve this customer when that happens? Are there hours that a customer can do laundry that will be “free” (and not count on their bill)?
From an operational point of view, Mercury can also use the graph to pop up other scenarios.
Are there vulnerable customers in an area that is experiencing meter, cable, or other issues? How can Mercury ensure those customers with medical issues get the electricity they need for life support systems, such as oxygen-breathing machines?
The graph solution allows Mercury to toggle between an operational view and a customer experience view.
As world leaders talk about reducing emissions and discuss net-zero carbon targets, the energy sector should double down on using renewable energy — and using it efficiently and effectively. Mercury has been able to do this with graph technology, which helps the company manage and monitor assets and best serve its customers. This translates to less energy consumed, less wasted energy, and lower customer bills. And in the case of energy and mitigating climate change, less is definitely more.

Todd Blaschka is the Chief Operating Officer at TigerGraph responsible for driving growth initiatives and scaling business operations. He is a technology industry veteran with nearly 20 years of sales leadership experience and a strong background in strategy and products. Prior to TigerGraph, Blaschka was vice president of worldwide sales at Clustrix, Inc. Additionally, he served as vice president of sales at Dataguise and has held various sales and marketing leadership positions at IBM, Electric Cloud and Sendmail, Inc., which was acquired by Proofpoint, Inc. in 2013.
LATEST NEWS
WHAT'S TRENDING
Data Science
5 Imaginative Data Science Projects That Can Make Your Portfolio Stand Out
OCT 05, 2022
SOURCE: HTTPS://WWW.IOTTECHNEWS.COM/
NOV 16, 2023
SOURCE: HTTPS://AITHORITY.COM/
OCT 03, 2023
SOURCE: HTTPS://WWW.SCIENCEDAILY.COM/
AUG 08, 2023
SOURCE: HTTPS://WWW.GLOBALLOGIC.COM
JUL 06, 2023
SOURCE: HTTPS://INDIAAI.GOV.IN/ARTICLE/HOW-DIGITAL-TWIN-TECHNOLOGY-WILL-EVOLVE-IN-2023
JUL 04, 2023
SOURCE: HTTPS://WWW.CNBC.COM/2023/01/21/DIGITAL-TWINS-ARE-SET-FOR-RAPID-ADOPTION-IN-2023.HTML
JUN 30, 2023