


Tech Mahindra launches a sports cloud platform built on AWS to provide an immersive fan experience globally
SOURCE: HTTPS://WWW.MAHINDRA.COM/
NOV 27, 2023
Data tagging in the NYC/Toronto subway
SOURCE: IOTWORLDTODAY.COM
SEP 15, 2021
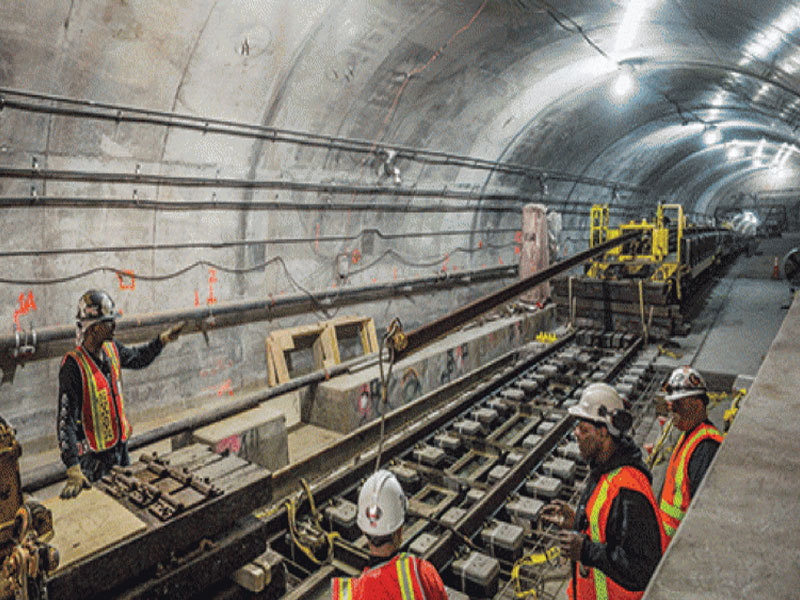
Here’s how BAI Communications employed InfluxDB’s time series database to drive insights from its metro rail Wi-Fi operation.
As public transit networks mobilize Wi-Fi connectivity options for passengers, there’s an opportunity to use data analytics to monitor station overcrowding patterns.
Metro rail operators need to understand how many passengers are waiting on platforms and in what numbers they’ll head for key interchanges on the network. It’s crucial to determine how many stewards should be posted to each station, as station overcrowding will lead to criminal incidents, and even dangerous falls onto the rail tracks.
Social distancing throughout the COVID-19 pandemic has required fewer passengers to be hosted within each station. That’s made it all the more vital for station managers to have access to adequate data outputs. One could even argue that the old expectations of metro networks – where passengers mainly got on with it cramming onto trains during peak hours – have gone for good.
But many rail operators lack the mindset to successfully harness data analytics for real-time station overcrowding management, according to Jeremy Foran, head of data analytics at BAI Communications, which has installed Wi-Fi systems for the Toronto and New York City subway systems.
“The rail industry has been traditionally apprehensive about leveraging new technology. If you dive into any sort of rail operator’s [operational technology] you’d think they were at least a decade behind.
“For them taking a risk means putting lives in danger. So the idea that there’s a new server that will solve some of their problems, for them that also means [another thing] that can go wrong [and cause people] to be injured.”
Foran has a solid record in putting data to use in mass transit systems. He joined BAI’s Canada division in January 2015 after a tenure as technology specialist at 21net, an in-cabin infotainment and Internet provider that has supplied Canada’s national rail system.
“In the 1970s – the Toronto subway system handed people punch cards and asked them to record their journeys and where they finished up.
“But that’s the last origin to destination [data] system that was done- and it was in the 1970s. Technology has changed quite a bit in the past 50 years.”
Rather than installing bespoke Internet of Things (IoT) sensors, BAI calculated how many people used its Wi-Fi access points in New York City’s and Toronto’s metro systems. It found access floated between 10% and 20% of overall footfall, and that this was a viable sample to build from.
“The rates are a little different between Toronto and New York. Toronto has pretty high mobile data rates, but they don’t wait at the station as long as they do in places in New York, where there are many more trains and services.”
Harnessing all of this data created bottlenecks. Consider that over 4.3 million people take New York City’s underground metro every day. Not every station has Wi-Fi connectivity, but the users who connect spend far fewer minutes online than peers in coffee shops or libraries.
“We have football stadiums moving through the network, every couple of minutes,” Foran said.
“And the way Wi-Fi is typically designed, it’s not able to handle that [amount of throughput] The frequency and velocity [of new user turnover] is problematic. When they allocate resources for a device, they’ll allocate them for, like 30 minutes.
“If you don’t hear from that device, in the next 12 seconds, the database needs to get rid of their spot on the network and the memory that has been allocated.”
BAI had to identify the best approach to manage end-to-end onboarding of new Web connections and handle every page rendered on a user’s mobile device. It’s a dilemma all too familiar to implementers delivering urban connectivity, which must cover asphalt jungles of cities spanning hundreds or thousands of square kilometers.
In terms of IoT delivery, the task is further complicated by the fact that a range of database architectures exist, both in the cloud and for devices. Machine learning may have ramped up the value of data insights from mass transit, but it will be wasted unless implementations can be explained to rail executives.
According to Nikolas Ioannou, a research staff member in the cloud and computing infrastructure unit at IBM, the typical IoT machine learning workload will require read-only access to process large amounts of data.
However they won’t require relational schema – special instructions that govern how different parts of the database link up to one another – which makes IoT and machine learning a special case for database purposes.
“For inference and for training, you typically go through a data set to predict on, or to train from. That typically doesn’t involve relational operations.
“There’s also filtering and pre-processing and streaming data – this is another machine learning use-case for IoT, where you might have one or more sources of data that you want to preprocess to be saved later on.”
In BAI’s case, the dilemma was largely averted by employing data analytics from the cloud, to which the Wi-Fi systems can send information directly.
Employing a connected device was thus superfluous, which reduced not only the cost but also the operational demands of maintaining its rail analytics functionality. Foran said the whole process was facilitated when the company decided to install a cloud-based time series database from InfluxDB, which enables the classification of information according to tags.
In a vindication of its technology, BAI was awarded a 20-year concession in June 2021 to serve high-speed mobile connectivity to the London Underground – the world’s oldest metro system and fourth largest in terms of network length.
“We can add tags as we go. When we gather information from an access point we can tag it to say that it’s at this station, or another for specific platforms,” Foran said.
“This gives us the ability to change the granularity of the business logic – and one of the most recent things we’ve started to do for some station managers is to look at other facilities — for example, passenger patterns in the mezzanine.”
“We add tags to those access points so [station managers] can now run aggregations against hand selected [sites]. We didn’t need to throw the baby out with bathwater; we didn’t need to change the schema of the database.”
LATEST NEWS
WHAT'S TRENDING


Data Science
5 Imaginative Data Science Projects That Can Make Your Portfolio Stand Out
OCT 05, 2022

SOURCE: HTTPS://WWW.MAHINDRA.COM/
NOV 27, 2023
SOURCE: HTTPS://WWW.IOTTECHNEWS.COM/
OCT 27, 2023
SOURCE: HTTPS://WWW.THEDAILYSTAR.NET/CAMPUS/
OCT 01, 2023
SOURCE: HTTPS://WWW.IOTFORALL.COM/
SEP 11, 2023
SOURCE: HTTPS://WWW.IOTTECHNEWS.COM/
AUG 10, 2023
SOURCE: HTTPS://WWW.SCIENCEDAILY.COM/
AUG 11, 2023