


White Castle to deploy voice-enabled digital signage in US
SOURCE: HTTPS://WWW.VERDICTFOODSERVICE.COM/
OCT 04, 2023
All you need to know about Gaussian mixture models
SOURCE: ANALYTICSINDIAMAG.COM
SEP 18, 2021

Clustering is one of the popular problems in the field of unsupervised learning. It is majorly used for identifying different groups in a given dataset based on similar characteristics. There are many algorithms available for clustering that can be used according to the requirement. Some of them are specific to data while some of them can work with any kind of data. Gaussian Mixture Model (GMM) is one of the methods used for clustering. In this article, we will understand in detail mixture models and the Gaussian mixture model that is used for clustering purposes. The major points to be discussed in this article are listed below.
In the field of unsupervised learning, probabilistic models which represent the probability of the presence of clusters within the overall population can be considered as mixture models.
These are not models since they are similar to the mixture distribution. Mixture distribution is a probability distribution of the data points in the data space. The basic approach of mixture distribution is that they derive the properties of the overall data space while mixture models are used to make inferences about the properties of the clusters presented in the data space.
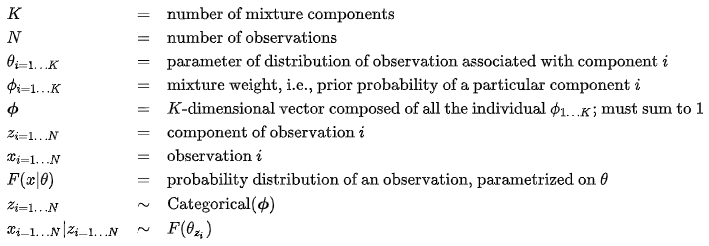
A general structure of a finite-dimensional mixture model consists of the following components:
A basic mixture model can be represented as:
Looking for a job change? Let us help you.
In addition, in a Bayesian setting where all the parameters are associated with a random variable (probabilities and parameters are random variables themselves), the structure can be represented as:
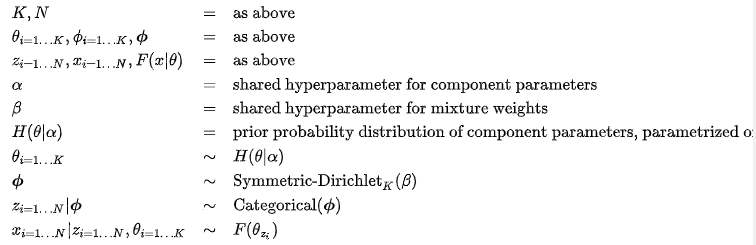
In this kind of structure, the set of probabilities is similar to the k-dimensional random vector derived from the conjugate prior to the categorical distribution. The parameters are distributed by their respective conjugate prior.
Common probability distributions used for the distribution of the mixture components are:
Mostly in the basic models, F and H represent the distribution of observation and parameters. Gaussian distribution is used in the case of real-valued observation and categorical distribution is used in the case of discrete observations.
Different types of mixture models are:
Let’s discuss the Gaussian mixture model. Before that, let’s have an understanding of Gaussian distribution.
As we have seen in the last discussed topic, the mixture models are used for clustering of the data. Here the Gaussian mixture model is a type of mixture model which is also called a mixture of gaussian. This also is not a model, actually, it is a probability distribution. This is a procedure for a data space where using gaussian or normal distribution we separate the overall population into different clusters. Let’s say it is a model for a better understanding of the topic. So the advantage of the model is that it does not require the specification of the relation between the data point and the cluster. The model learns the specifications of subclusters automatically and using its learning it clusters the data points.
the gaussian distribution or normal distribution is one of the popular distributions and most used distribution in the field of data science. It is a continuous probability distribution for real-valued random variables. Where continuous probability distribution gives support in an uncountable set such as a part of a line. Let’s take an example to understand it more.
In the below table, we have data points that consist of the speed and paddle frequency of the cycle.
| Speed (Km/h) | Frequency |
| 1 | 4 |
| 2 | 9 |
| 3 | 6 |
| 4 | 7 |
| 5 | 3 |
| 6 | 2 |
In the above table, we can see that as the speed is increasing the count of the frequency of the paddle decreases after a point of speed. Let’s say the below image shows the distribution of our data points.
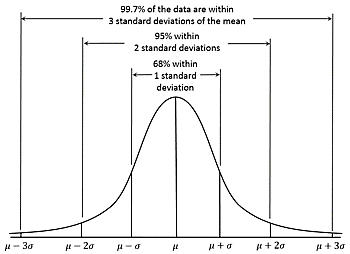
Here half of the points are lying on the left side and half of the data points are lying on the right side of the graph. By the image, we can say the distribution of the points following the bell curve is why the points are following the Gaussian distribution.
In statistics, the Gaussian distribution is the probability distribution that is symmetric about the mean of its data points. This means that most of the data points in data space are closer to the mean value of all data points instead of being far from the mean. The centre of the bell curve is the mean of all the data points and the spread of the data points can be represented by the standard deviation.
This distribution can be used for making a set of some data points from a given data set. If the data points are coming under the good curve they can be extracted from the data set and put into the set of data points that are following the Gaussian distribution.
We can measure the probability of any data point to be part of the curve using the probability density function. The standard normal distribution has the probability density function as:
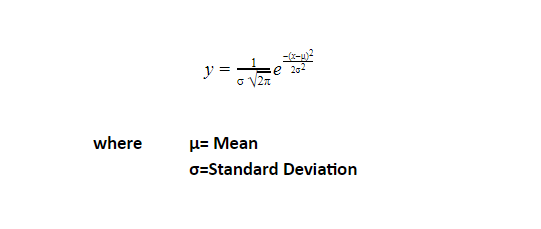
In the above formula, Y is a probability density function for a data point x which tells the probability of x to be presented in the bell curve.
The unsupervised data comes with highly spread data points and it becomes difficult to manage them in different clusters using this method. We can cluster them but the big question is: why do we follow this method?
So as we discussed in Gaussian distribution, we try to fit different data points under the bell curve wherein the bell curve there was a peak value which we called the mean of the data points coming under the curve. And all the points under the bell curve are highly related to each other and they can create a cluster of data points. Since the Gaussian distribution is a continuous probability distribution the data set following the Gaussian distribution can be considered as highly polished data which can be more suitable for further machine learning or data science operations.
As we know, unsupervised data can consist of multiple sets of data points that can follow the Gaussian distribution which directly means in the data there can be multiple peaks presented in any data and extracting such data from a huge data set can be done by the Gaussian mixture model.
For example in unsupervised data there are three sets of data points that follow the Gaussian distribution which means we can build three bell curves on, there will be three mean or peak points. In this type of data set, the gaussian mixture model defines the probability for data points to belong to any of the distributions. This is why we consider it as the probability distribution.
The probability distribution function of GMM can be defined as:

In the above expression, we are using the covariance matrix which holds the magnitude of changes in a variable of the data set in the effect of another variable. Basically, it shows the relationship between two variables. Using a covariance matrix in place of the standard deviation gives more accurate results.
The covariance of any two variables X and Y is defined as:
Cov[X, Y ] = E[(X ? E[X])(Y ? E[Y ])] = E[XY ] ? E[X]E[Y ]
where the operator E denotes the expected value (mean) and the formula for covariance matrix will be

The probability given in a mixture component of K Gaussian distribution is:
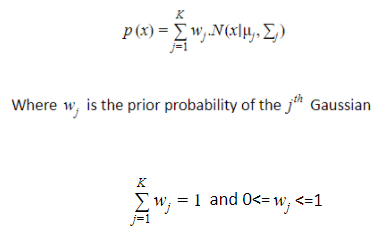
By multiplying the probability distribution function of the d-dimension to the prior probability of each of our Gaussians, we can calculate the probability value X for a given data point.
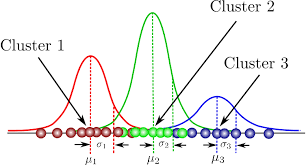
Above we can see the representation of clusters made by GMM. Here we can see 3 clusters which mean the given data set can be divided into 3 parts according to the GMM. Since there are several clustering methods next in the article we will compare GMM with K-means clustering.
As we have discussed, GMM is a clustering method using a probability distribution. K-means clustering is also a clustering method but uses euclidean distance to calculate the difference between data points as closer data can be segregated in one cluster, this is a big difference between K-mean and GMM. instead of it, we have discussed that the covariance uses the relationship in the formula of a gaussian mixture model where the k means gives the hard assignments to the data points, which means, it forces the data points to be in a cluster without caring about the proper distribution of the data points in the defined cluster.
As we have discussed above, a mixture model uses the random variable that’s why it is a stochastic model and gradient descent computes the derivative of the data which results in the optimal direction for the data points where data points should move to achieve a well-defined cluster. With random variables, it is not possible to compute the derivative of the data. We can also say that GMM is a non-deterministic model.
Since we have discussed that it works on random data very well. So its application is mostly related to data such as signal and audio, image and video, etc. Where a small change in any data point can cause a change in almost all data.
There are various applications of the GMM. It can be used in signal processing for abstracting various useful features of the signal data, it has the ability to provide good results in speech recognition. Instead of signal processing, it is also useful in image processing and computer vision where it can be used in image segmentation and anomaly detection.
In this article, we have seen how the mixture model works and we also discussed the Gaussian mixture model in detail and seen how it is different from the K- means and gradient descent. In conclusion, we can say that using it with data consisting of a random variable can be beneficial for further processing. You can use this method in various clustering procedures. GMM can be very helpful in converting your unsupervised data into sets of clean and well-classified data.
LATEST NEWS
Augmented Reality
Hi-tech smart glasses connecting rural and remote aged care residents to clinicians
NOV 20, 2023
WHAT'S TRENDING


Data Science
5 Imaginative Data Science Projects That Can Make Your Portfolio Stand Out
OCT 05, 2022

SOURCE: HTTPS://WWW.VERDICTFOODSERVICE.COM/
OCT 04, 2023
SOURCE: HTTPS://RESEARCH.AIMULTIPLE.COM/
JUL 12, 2023
SOURCE: HTTPS://RESEARCH.AIMULTIPLE.COM/
JUL 11, 2023


SOURCE: TECHCRUNCH.COM
OCT 27, 2022


SOURCE: THEHINDU.COM
OCT 16, 2022